Bucks County PA Housing Market Report | Sept 2026
Bucks County's September: Buyers Gain the Upper Hand on Negotiating
Of our three counties, Bucks County showed the biggest shift toward buyers in September.
Active listings hit a five-year September high. Homes took longer to sell, and the average home sold for 98.1% of its original asking price, the lowest September figure in five years.
Prices are still slightly higher than a year ago. Here's what I'm seeing in the numbers and what it may mean for you.
New Listings Picked Up After Summer
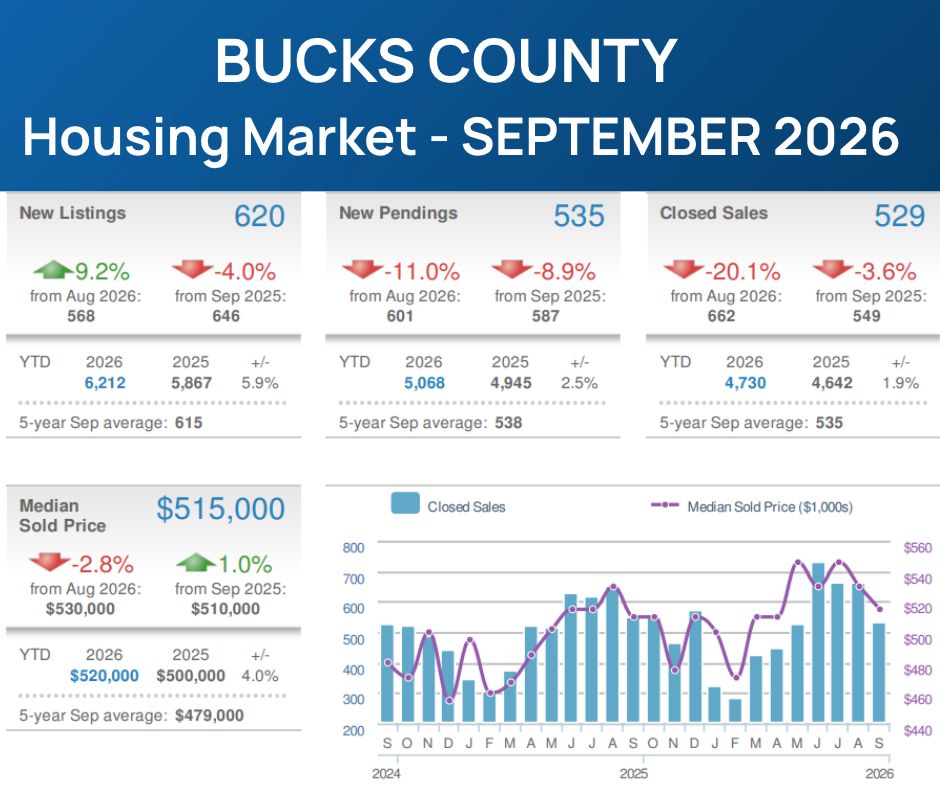
Bucks County recorded 620 new listings in September. That was up 9.2% from August's 568 and down 4.0% from September 2025's 646. It was right in line with the five-year September average of 615.
Through September, 6,212 homes were listed, up 5.9% from the same period last year. That is the biggest year-over-year increase in new listings of our three counties.
Fewer Homes Went Under Contract
There were 535 new pending sales in September. That was down 11.0% from August and 8.9% from last September. It was close to the five-year September average of 538.
Through September, 5,068 homes went under contract, up 2.5% from last year.
Closings Fell From a Busy August
September ended with 529 closed sales. That was down 20.1% from August's 662 and 3.6% from last September's 549. It was slightly below the five-year September average of 535.
August was a strong month for closings, so some of this drop is simply the calendar. Year to date, Bucks County recorded 4,730 closed sales, up 1.9% from last year.
Prices Held Close to Last Year
The median sold price was $515,000. That was down 2.8% from August's $530,000 and up 1.0% from September 2025's $510,000. It was well above the five-year September average of $479,000.
The median moves with the mix of homes that sell each month, so a small step down from summer doesn't mean values fell.
Through September, the year-to-date median sold price was $520,000, up 4.0% from $500,000 last year.
Buyers Have More Choice and More Leverage
Bucks County ended September with 1,062 active listings, up from 981 in August and 880 last September. That was the highest September total in the five-year range, and well above the five-year average of 821.
Homes took an average of 29 days to sell, compared with 20 days in August and 30 days last September. The five-year September average is 24 days.
The average home sold for 98.1% of its original asking price, down from 99.5% in August and 98.2% last September. That was the lowest September figure in the five-year range.
In plain English, Bucks County buyers have the most room to negotiate of our three counties right now. Sellers who price above the market should expect their home to sit longer.
Third Quarter at a Glance
For July through September, the median sold price was $530,000, up 2.1% from the third quarter of 2025. A total of 1,892 homes sold, up 2.3% from 1,850 a year earlier. Homes sold in an average of 23 days, the same as last year.
A Quick Look at Mortgage Rates
Freddie Mac's weekly survey placed the national average 30-year fixed mortgage rate at 7.40% as of October 8, 2026, up from 6.71% in early September. Higher rates may be part of why fewer buyers signed contracts in September.
That is a national average, not a rate every buyer will receive. Rates vary by lender, credit score, down payment and loan type, and they can change daily. Comparing more than one lender matters even more when rates are moving.
What This Means If You're Thinking About Selling
Buyers in Bucks County have more choices than in any September of the last five years. Your first weeks on the market matter most, so price for today's market from the start.
Presentation counts too. Homes that show well and are priced right still sell, and prices are holding.
If a buyer asks for help with closing costs, don't dismiss it. A seller concession can sometimes get a deal done for less than a price cut would cost you.
What This Means If You're Thinking About Buying
This is a good time to be a prepared buyer in Bucks County. You have more homes to choose from and more room to negotiate on price and terms.
Get fully preapproved, know your budget at today's rates and look closely at recent comparable sales. The goal is not just to win the house. It's to buy the right house on terms that make sense for you.
The Bottom Line
Bucks County's September tilted toward buyers. Inventory reached a five-year September high, homes took longer to sell and sellers gave a little more ground on price. Values are still holding, though, so this is a more balanced market, not a falling one. That’s also when a good Realtor earns their keep: pricing your home right from day one, reading the other side in a negotiation and spotting problems before they derail a deal.
See How Bucks County Compares
Read the September 2026 Montgomery County Housing Market Report and September 2026 Chester County Housing Market Report for a broader look at our regional housing market.
Planning a Move This Fall?
Whether you're buying, selling or still weighing your options, Rick's guides explain what to expect and how to prepare:
See what homes are really selling for in your neighborhood. Request your custom market analysis at ricksheppard.com/evaluation.
Have Questions? Let's Talk
If you'd like to know what your home is worth, or simply want an honest conversation about whether moving makes sense for your situation, I'm always happy to talk. No pressure, just useful information.
Rick Sheppard Associate Broker | eXp Realty, LLC License #AB061272L 610-864-9872 rick@ricksheppard.com ricksheppard.com
Housing data sourced from Bright MLS via MarketStats by ShowingTime. Statistics reflect Bucks County, Pennsylvania, for September 2026 and the third quarter of 2026, and were calculated October 8, 2026. Mortgage rate from the Freddie Mac Primary Mortgage Market Survey, October 8, 2026.
Categories
Recent Posts