October 2026 Chester County Housing Market Update
More Homes for Sale, Still Selling Fast: Chester County's October Market
Chester County buyers had more homes to choose from in October. There were 1,047 active listings at the end of the month, up 15.7% from last year and the most for any month in the past five years.
Fewer buyers signed contracts. 475 homes went under contract, down 7.8% from last October, and showings fell 10.5%.
But the homes that sold went fast and close to full price. Homes that sold spent an average of 24 days on the market, three days faster than last October, and homes sold for 100.1% of their original list price on average. The median sale price was $550,000, the highest October median in the past five years.
Here's what I'm seeing in the numbers and what it may mean for you.
October at a Glance
| Chester County | October 2026 | October 2025 | Change |
|---|---|---|---|
| New listings | 557 | 591 | -5.8% |
| New contracts (pendings) | 475 | 515 | -7.8% |
| Closed sales | 483 | 458 | +5.5% |
| Showings | 5,920 | 6,617 | -10.5% |
| Median sale price | $550,000 | $545,000 | +0.9% |
| Sale to original list price (avg.) | 100.1% | 98.8% | +1.3 points |
| Average days on market | 24 | 27 | -3 days |
| Active listings (end of month) | 1,047 | 905 | +15.7% |
| Months of supply | 2.2 | 1.9 | +0.3 months |
| Closed sales, year to date | 4,797 | 4,750 | +1.0% |
| Median sale price, year to date | $565,000 | $550,565 | +2.6% |
Buyer Activity: Contracts and Showings Slowed
New contracts, also called pendings, are the most current signal we have, because they show deals being signed right now.
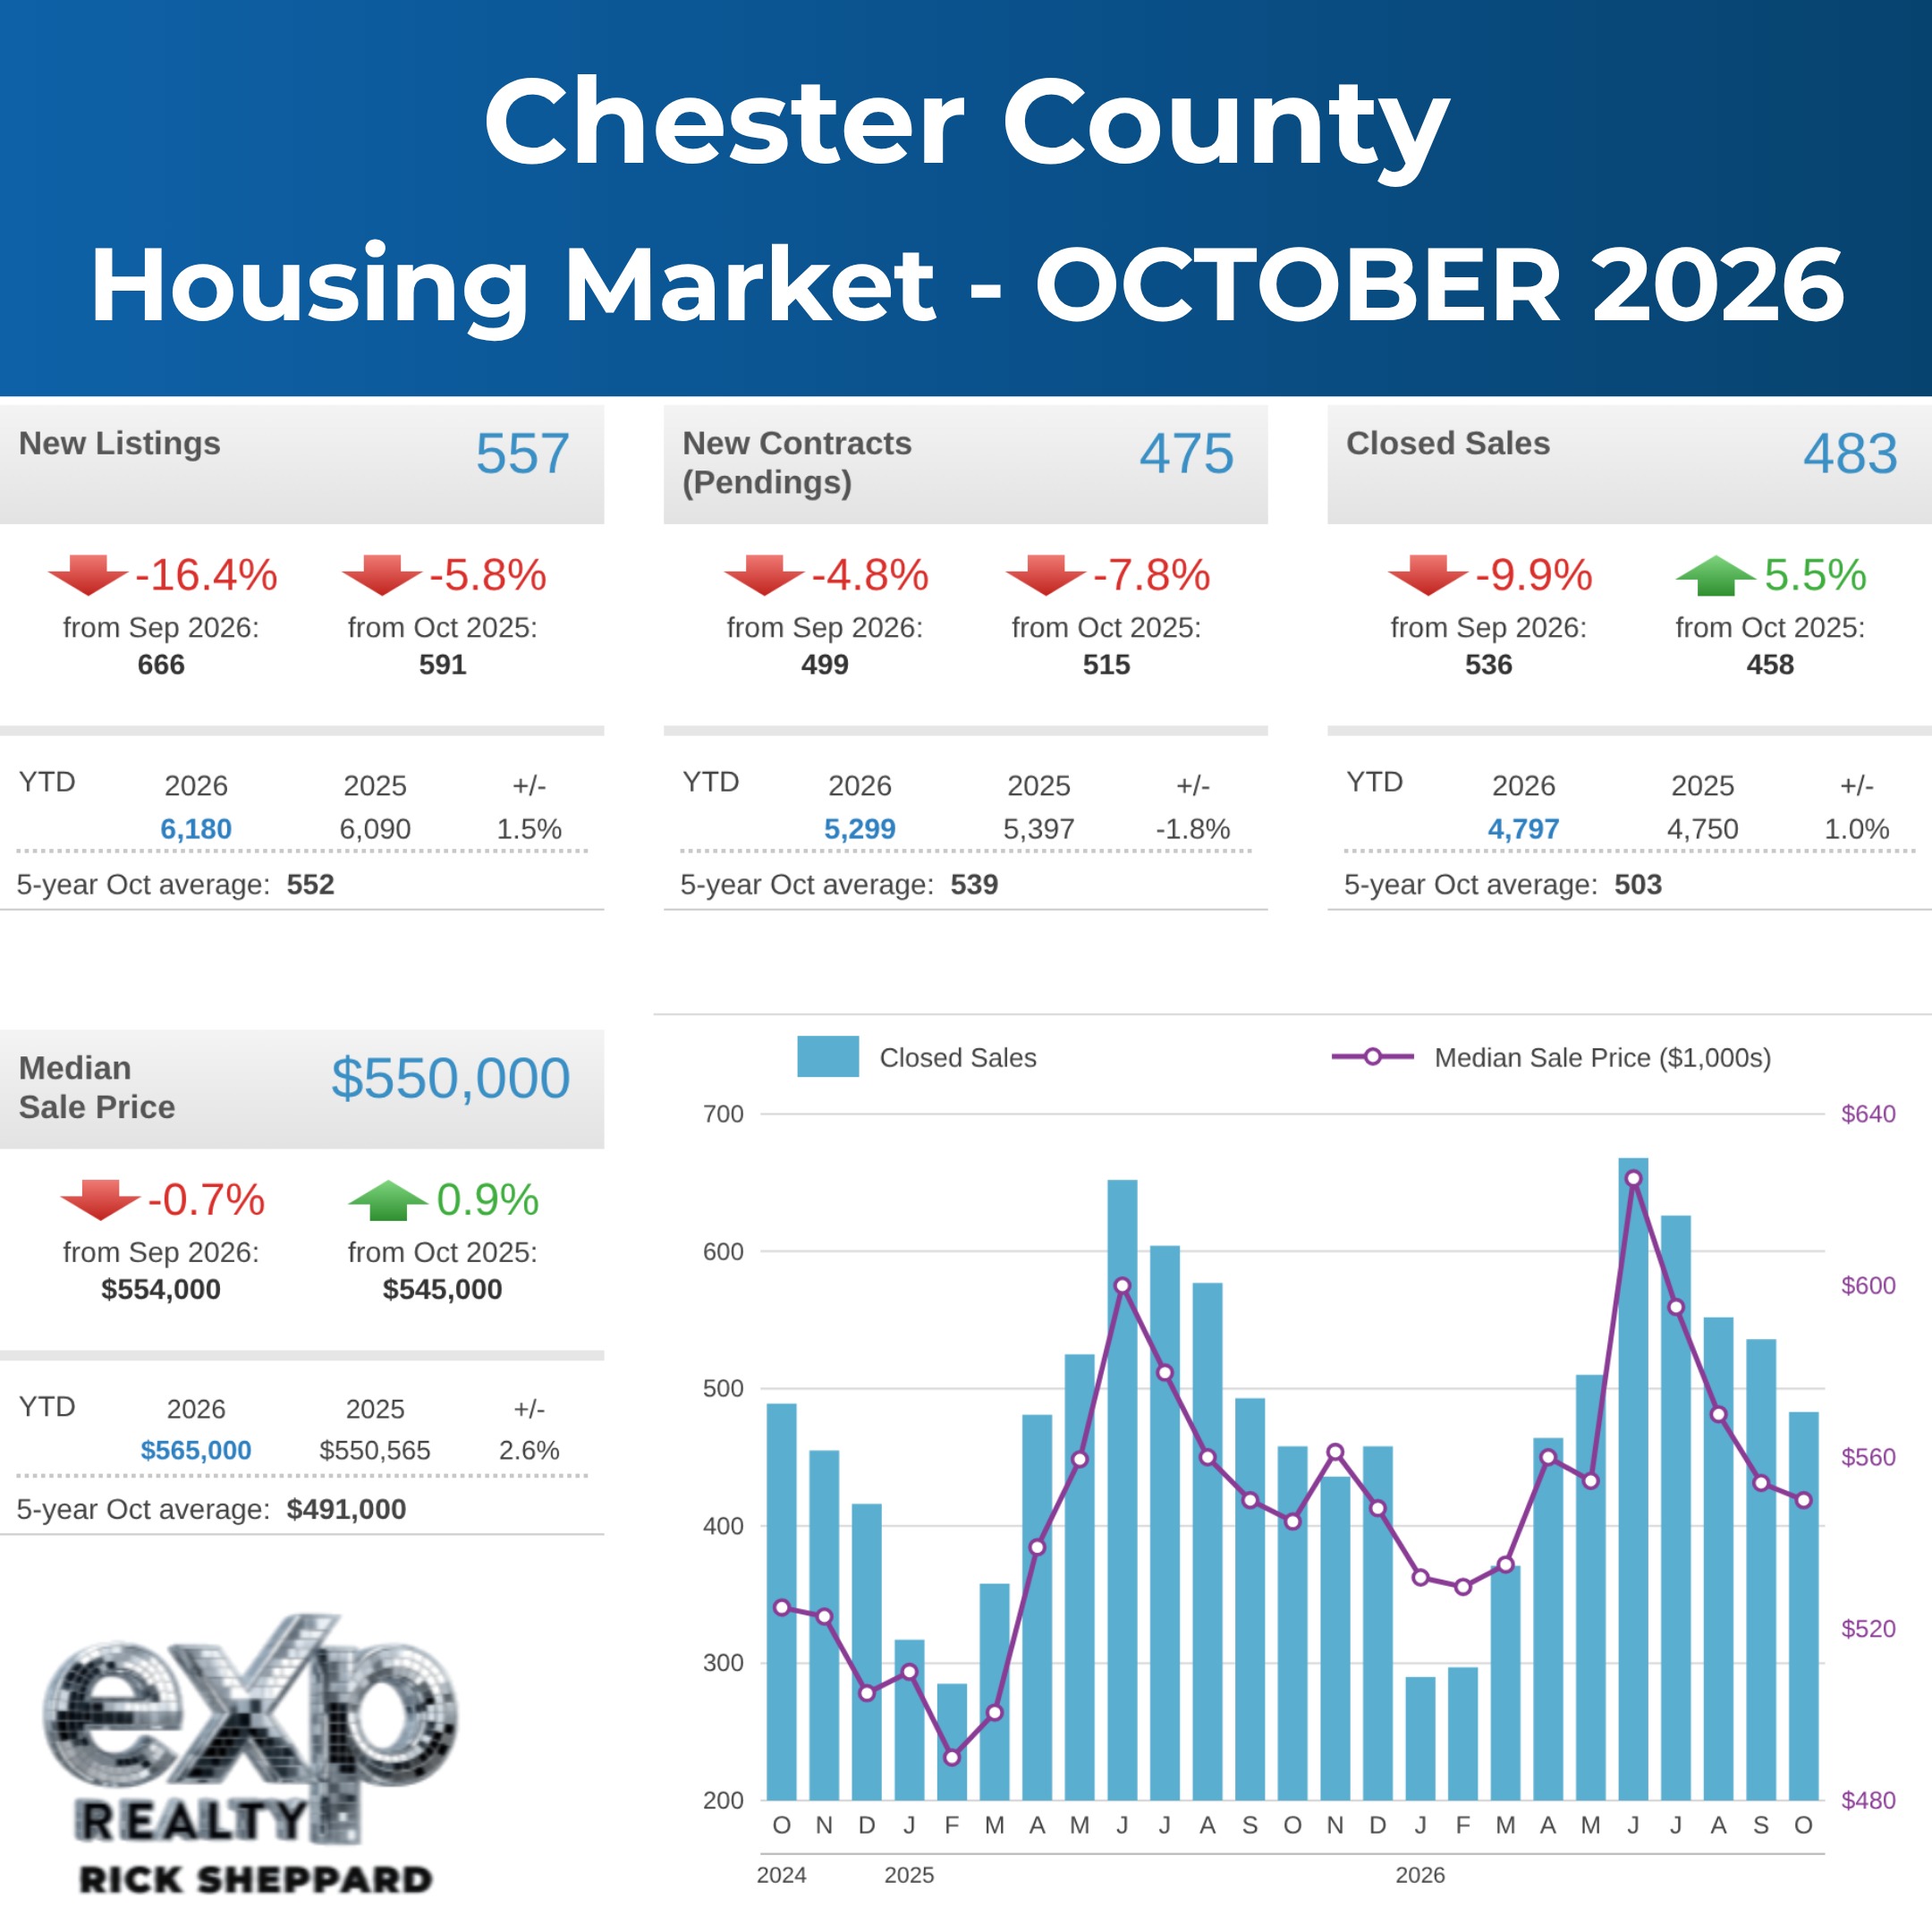
475 homes went under contract in October, down 7.8% from last October and below the five-year October average of 539. Showings fell 10.5% to 5,920.
Higher mortgage rates and prices may be part of why some buyers are waiting. Year to date, contracts are down 1.8% from last year.
New Listings: Slightly Fewer Than Last Year
557 homes came on the market in October, down 5.8% from last October and close to the five-year October average of 552.
Year to date, 6,180 homes have been listed, up 1.5% from last year.
Closed Sales: 483 Homes Sold
483 homes closed in October, up 5.5% from last October. Keep in mind that closings reflect contracts signed weeks earlier, mostly in September.
Year to date, 4,797 homes have sold, up 1.0% from last year.
Median Sale Price: $550,000
The median sale price in October was $550,000, up 0.9% from $545,000 last October. That's the highest October median in the past five years and well above the five-year October average of $491,000.
It's also the fifth month in a row that the median was higher than the year before. Year to date, the median is $565,000, up 2.6% from last year.
The median moves with the mix of homes sold each month. It doesn't mean every home in the county changed in value by the same amount.
Inventory, Pace and Sale-to-List Price
Homes for sale: 1,047 active listings at the end of October, up 15.7% from 905 last October. That's the most for any month in the past five years.
Months of supply: 2.2 months, up from 1.9 last October. This is roughly how long it would take to sell every home on the market at the current pace.
Days on market: Homes that sold in October spent an average of 24 days on the market, down from 27 last October. The five-year October average is 21 days.
Sold price vs. original list price: On average, homes sold for 100.1% of their original list price, up from 98.8% last October.
In plain English, buyers have more homes to choose from than at any point in the past five years. Even so, 2.2 months of supply is still low, and homes that sold went under contract faster and closer to full price than a year ago.
A Quick Look at Mortgage Rates
According to Freddie Mac, the average 30-year fixed mortgage rate was 7.18% as of November 5, 2026. That's down from 7.24% the week before, the third weekly drop in a row.
This is a national average. Your rate may be higher or lower depending on your lender, credit score, down payment and loan type.
What This Means If You're Thinking About Selling
Well-priced homes are still selling quickly. Homes that sold spent three fewer days on the market than last October, and they sold for just over their original list price on average.
But there are more homes for sale than at any point in five years, and fewer buyers signed contracts. Pricing your home right from day one and having it show well matter more now. Homes that start too high may sit while buyers look at the other choices.
What This Means If You're Thinking About Buying
You have more homes to choose from than at any point in the past five years. That said, the best homes are still moving fast, so it helps to be ready.
Getting pre-approved and knowing your monthly budget will help you act with confidence when you find the right home. Homes that have been on the market longer may leave more room to talk about price, repairs or closing costs.
The Bottom Line
Chester County's market is mixed. Inventory reached a five-year high and fewer buyers signed contracts, while the homes that did sell went quickly and near full price.
Every neighborhood and price range is a little different. If you'd like to know what these numbers mean for your home or your search, I'm happy to walk you through it.
See How Chester County Compares
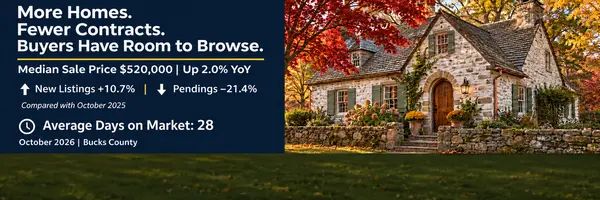
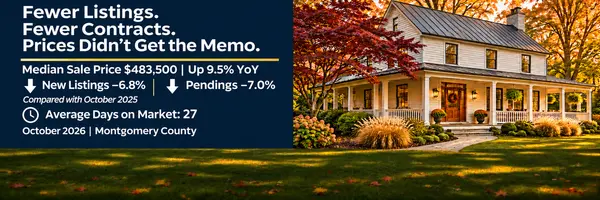
Check out my October 2026 reports for Montgomery County and Bucks County to see how our neighboring markets are doing.
Planning a Move This Winter?
Have Questions? Let's Talk
If you'd like to know what your home is worth, or simply want an honest conversation about whether moving makes sense for your situation, I'm always happy to talk. No pressure, just useful information.
Rick Sheppard
Associate Broker | eXp Realty, LLC
License #AB061272L
610-864-9872
rick@ricksheppard.com
ricksheppard.com
Housing data sourced from Bright MLS (Bright Stats). Statistics reflect all home types in Chester County, Pennsylvania, for October 2026. Days on market is the average for homes sold that month. Five-year averages use the Octobers of 2021 through 2025. Mortgage rate from the Freddie Mac Primary Mortgage Market Survey, November 5, 2026.
Categories
Recent Posts