Montgomery County Housing Market: Spring Has Officially Sprung!
March arrived and the Montgomery County housing market wasted no time waking up. After a quieter winter, buyers and sellers both showed up in force — and the numbers tell a story of a market that is energized, competitive, and still very much on the move. Whether you're thinking about listing, buying, or just keeping tabs on your biggest investment, here's everything you need to know.
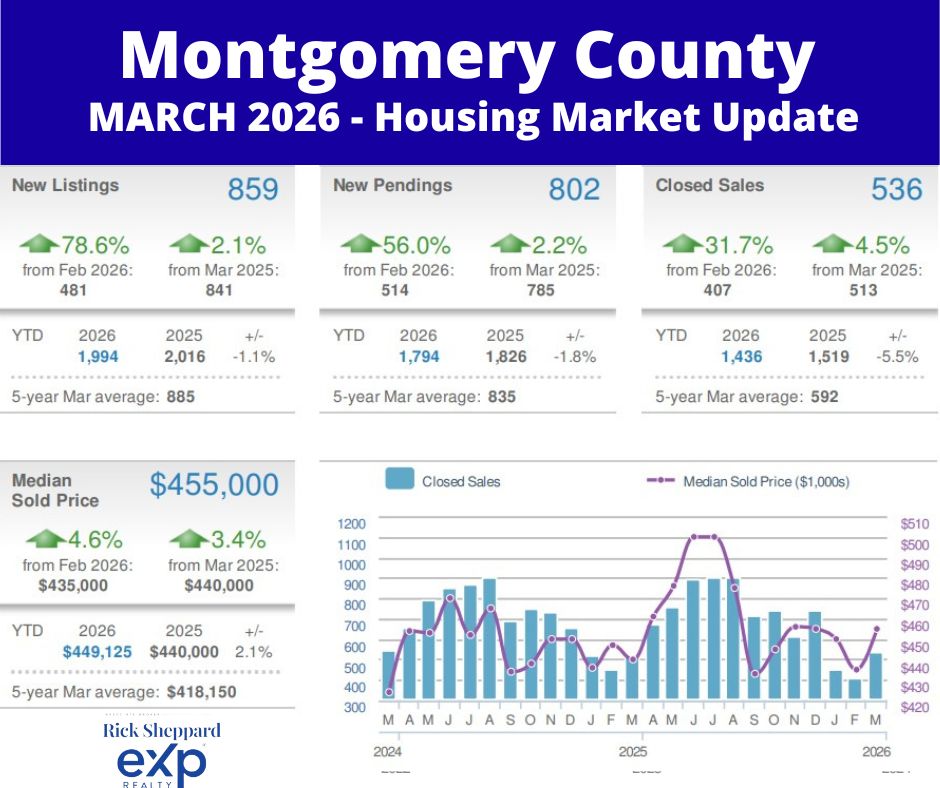
The Big Picture: March 2026 By the Numbers
The data paints a clear picture: supply is rising, demand is keeping pace, and prices continue to climb year over year — a classic spring market in full swing.
Metric |
March 2026 |
Change from Feb 2026 |
Change from March 2025 |
|
New Listings |
859 |
+78.6% |
+2.1% |
|
New Pendings |
802 |
+56.0% |
+2.2% |
|
Closed Sales |
536 |
+31.7% |
+4.5% |
|
Median Sold Price |
$455,000 |
+4.6% |
+3.4% |
|
Active Listings |
889 |
+9.9% (vs. Feb 809) |
+15.5% (vs. Mar 2025 770) |
|
Avg. Days on Market |
36 |
+2.9% (vs. Feb 35) |
+24.1% (vs. Mar 2025 29) |
The Nitty Gritty: What Does It All Mean?
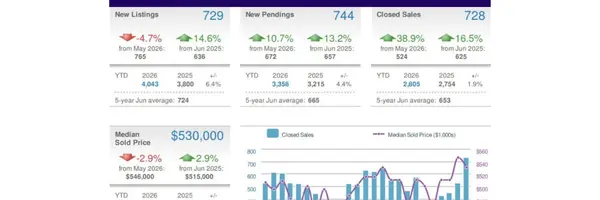
Listings & Sales: The Spring Surge Is Real
New listings exploded by nearly 79% compared to February — but before you read too much into that, remember that February is historically one of the slowest months of the year for new inventory. The more meaningful signal is the 2.1% year-over-year gain, confirming that more sellers are stepping off the sidelines compared to last March. Buyers responded in kind: new pendings jumped 56% month-over-month and are up 2.2% from a year ago, signaling that demand is absorbing the new supply almost as fast as it arrives. Closed sales of 536 homes — up 4.5% year-over-year — reflect the strong contract activity we saw in late winter, and that momentum is only building.
Prices: Steady Appreciation, No Signs of Slowing
The median sold price in Montgomery County hit $455,000 in March, a 3.4% gain over March 2025 and a solid 4.6% jump from February. The YTD median of $449,125 is running 2.1% ahead of last year's pace, and the 5-year March average of $418,150 puts the current market in sharp perspective — values have climbed meaningfully over the medium term. The average sold-to-original-list-price ratio of 98.8% (up from 98.4% in February) tells you that sellers are getting very close to what they're asking, and buyers aren't finding much room to negotiate.
Inventory & Time on Market: More Options, But Still a Seller's World
Active listings rose to 889, up from 809 in February and 770 a year ago — a 15.5% year-over-year increase that gives buyers a bit more to choose from than they had last spring. Average days on market ticked up to 36 days, compared to 29 days in March 2025. That's a meaningful shift: homes are sitting slightly longer, which means buyers have a touch more breathing room than the frenzied pace of a year ago. That said, with a 98.8% sold-to-list ratio and pendings keeping pace with new listings, this remains firmly a seller's market — just one with a little more balance creeping in at the edges.
Mortgage Rate Roundup
As we release this report on April 11, 2026, there is some genuinely good news for buyers on the rate front. The average 30-year fixed-rate mortgage is currently at 6.41% [1] — down from 6.51% last week and meaningfully below the 7%-plus range buyers faced this time last year. For a buyer purchasing at the March median of $455,000 with 20% down, that translates to a more manageable monthly payment than much of the past year. Bankrate projects the average 30-year rate for 2026 will settle around 6.1%, meaning further relief may be on the way for buyers as the year progresses.
The Bottom Line: Sellers Hold the Cards, But the Game Is Getting Interesting
Montgomery County's spring market is off to a strong start. Sellers enjoy rising prices, near-full asking-price offers, and demand that is absorbing new inventory quickly. Buyers, meanwhile, are finding slightly more homes to choose from and a modestly longer decision window than last year — and with rates trending down, purchasing power is quietly improving. If you've been waiting for the right moment to make a move, the market is telling you that moment is now.
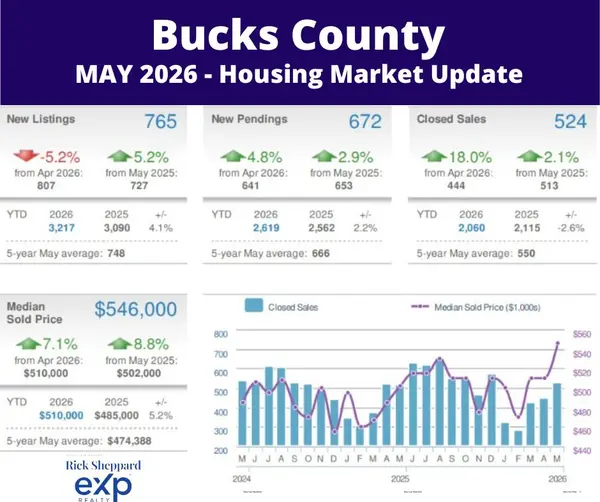
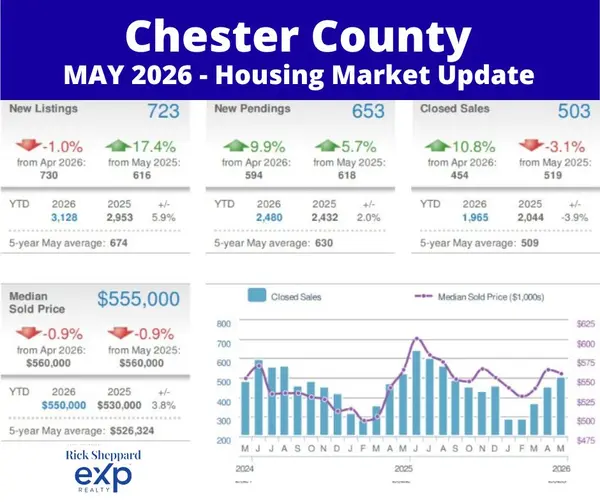
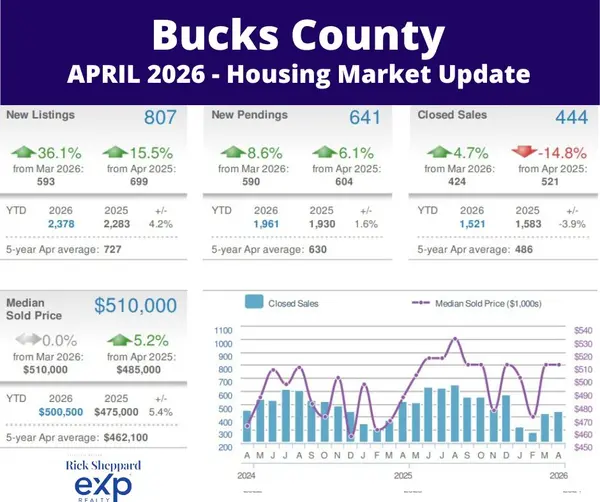
See how this compares to other local markets! Read our Bucks County Market Report and Chester County Market Report for a full regional picture.
See what homes are really selling for in your neighborhood. Get your custom market analysis here — complete with hyperlocal pricing trends, inventory levels, and comparable sales data that matter most to your home buying or selling decision.
Categories
Recent Posts