Chester County Housing Market: Spring Has Sprung — and So Have Prices!
March arrived in Chester County with a burst of energy that matched the season perfectly. Listings surged, buyers flooded back to the market, and home values continued their steady climb — making it clear that spring 2026 is shaping up to be a competitive one. Whether you're thinking about buying, selling, or just keeping tabs on your neighborhood, here's everything you need to know about last month's market.
The Big Picture: March 2026 By the Numbers
The data tells a story of a market firing on all cylinders — strong demand, rising prices, and a healthy dose of competition between buyers.
Metric |
March 2026 |
Change from Feb 2026 |
Change from Mar 2025 |
|
New Listings |
582 |
+63.5% |
-2.0% |
|
New Pendings |
525 |
+45.8% |
-11.2% |
|
Closed Sales |
365 |
+25.9% |
+3.4% |
|
Median Sold Price |
$536,875 |
+2.1% |
+7.4% |
|
Active Listings |
645 |
+13.6% |
+6.9% |
|
Avg. Days on Market |
32 |
-3.0% |
+33.3% |
The Nitty Gritty: What Does It All Mean?
Listings & Sales: The Spring Surge Is Real
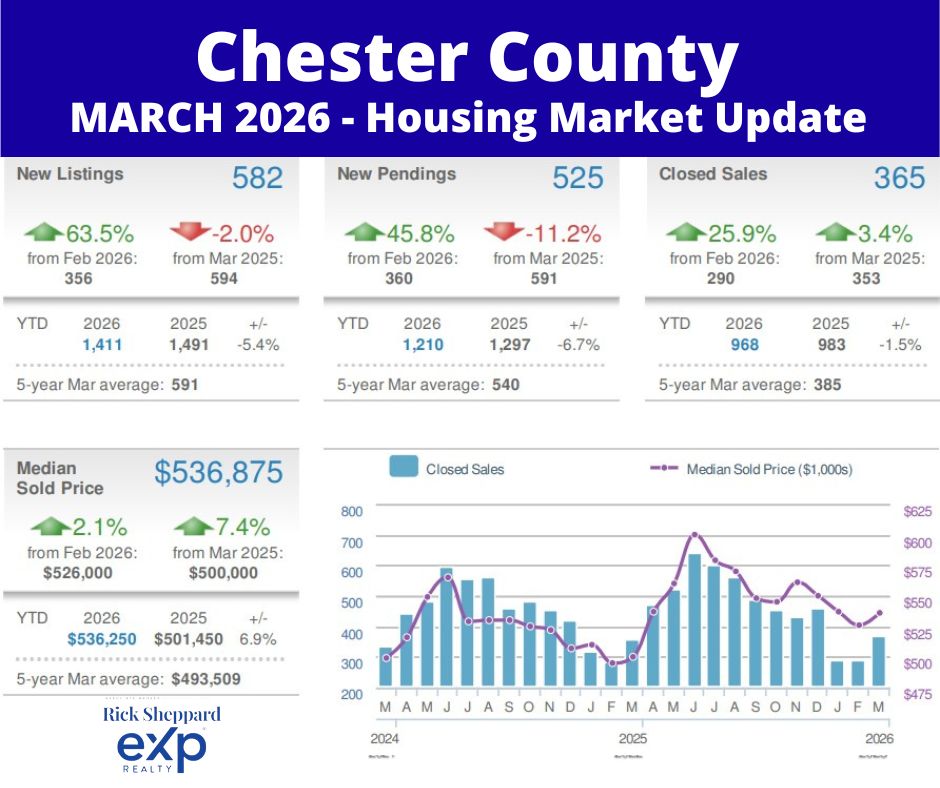
After a quiet February, Chester County's market woke up in a big way. New listings jumped 63.5% from last month to 582 — a welcome sign that more homeowners are ready to make their move. Buyer demand matched that energy, with 525 new pendings representing a 45.8% month-over-month surge. Closed sales also climbed 25.9% from February, landing at 365 — and up 3.4% compared to March 2025. While the year-over-year pending count is down 11.2%, that's worth keeping in perspective: March 2025 was an exceptionally strong month, and this year's numbers still outpace the 5-year March average of 540 pending sales.
Prices: Appreciation That Keeps on Giving
The median sold price in Chester County hit $536,875 in March — a 7.4% increase over March 2025's $500,000 median. That's not a blip; that's a trend. The YTD median of $536,250 is running 6.9% ahead of last year's pace, and both figures comfortably exceed the 5-year March average of $493,509. The average sold-to-original-list-price ratio came in at 100.8%, meaning homes are selling above their asking prices on average. Sellers are in the driver's seat, and buyers who hesitate are often finding themselves outbid.
Inventory & Time on Market: More Choices, But Still Competitive
Active listings grew to 645 — up 13.6% from February and 6.9% above March 2025. That's the highest inventory level in the 5-year range tracked in this report (min: 373, max: 645), which does give buyers a bit more breathing room than they've had in recent years. Still, homes are moving quickly: the average days on market was just 32 days, ticking down from 33 in February. While that's up from the blazing-fast 24-day pace of March 2025, it's still well within seller's market territory. More inventory is a positive development, but don't mistake "more options" for "less competition" — well-priced homes are still flying off the market.
Mortgage Rate Roundup
As we release this report on April 11, 2026, there's genuinely good news on the rate front. Mortgage rates have declined five days in a row, and the average 30-year fixed-rate mortgage is currently sitting at 6.41% [1] — still well below the 7%-plus territory buyers faced in early 2025. For a buyer purchasing at Chester County's median price with 20% down, that's a manageable monthly payment in the context of a market where home values are appreciating at 7.4% annually. If you've been waiting on the sidelines, the combination of more inventory and a stabilizing rate environment makes this a compelling moment to re-engage.
The Bottom Line: A Seller's Market With a Side of Opportunity
Chester County's March numbers confirm what many local agents have been feeling on the ground: this is a seller's market, full stop. Prices are up 7.4% year-over-year, homes are selling above list price, and the market absorbed a big wave of new listings without missing a beat. That said, the uptick in active inventory is a genuine silver lining for buyers — more homes to choose from, and slightly less of the frantic, blink-and-you'll-miss-it pace of 2025. Heading into April and May, expect continued competition for well-priced, move-in-ready homes, while properties that need work or are priced aggressively may sit a bit longer.
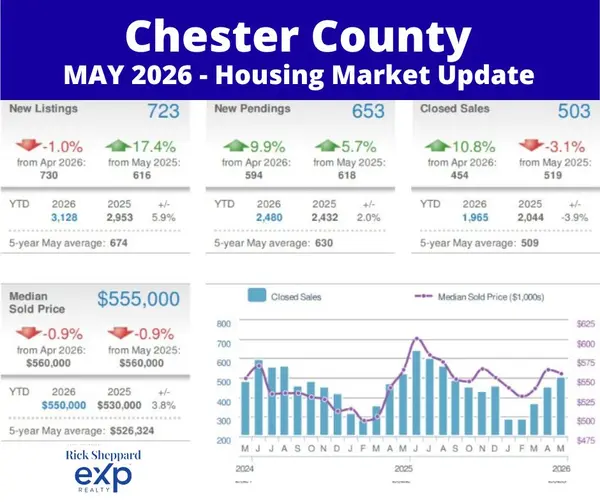
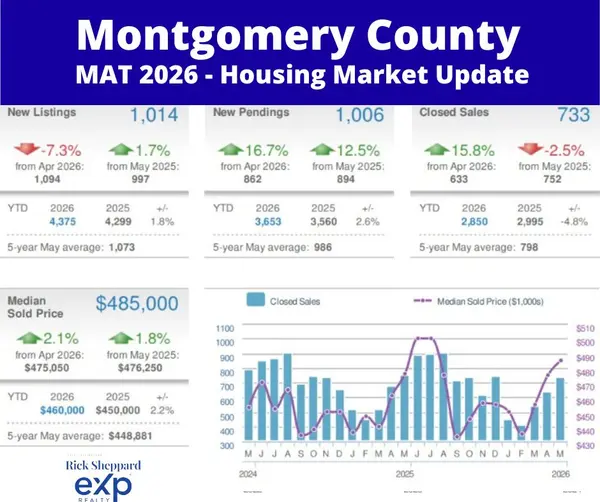
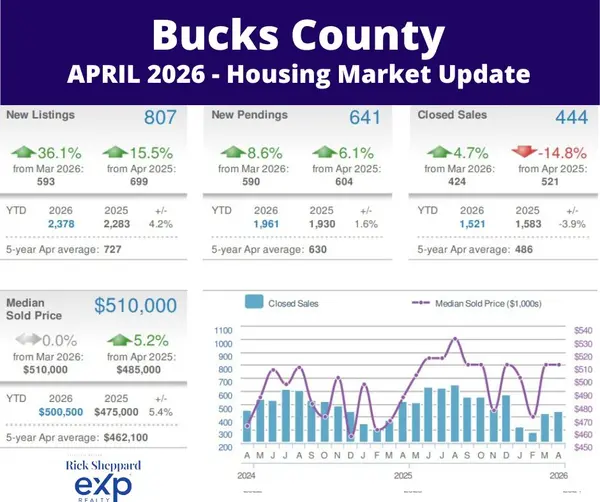
See how this compares to other local markets! Read our Montgomery County Market Report and Bucks County Market Report for a full regional picture.
See what homes are really selling for in your neighborhood. Get your custom market analysis here – complete with hyperlocal pricing trends, inventory levels, and comparable sales data that matter most to your home buying or selling decision.
[1] Bankrate, Current Mortgage Rates: Compare Today's Rates, April 11, 2026.
Categories
Recent Posts