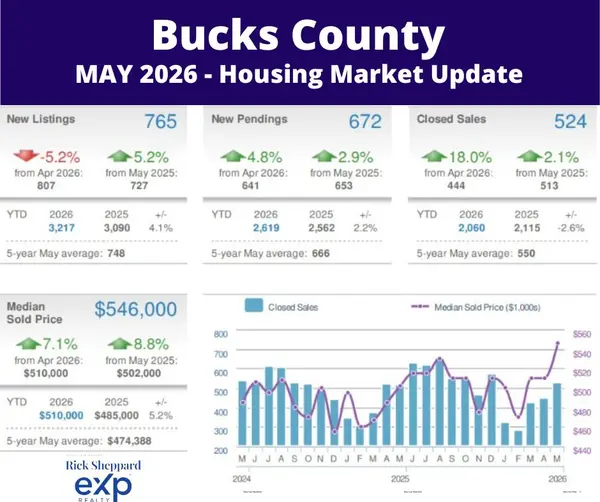
Bucks County Housing Market: Wild Swings, Hot Market!
Spring has fully taken hold in Bucks County, and the April 2026 housing market data proves it. New listings surged, buyer demand remained robust, and home values continued their steady climb — all while the broader market wrestles with mortgage rates that are still keeping some would-be buyers on the sidelines. If you've been wondering whether now is the time to make a move, the numbers tell a compelling story.
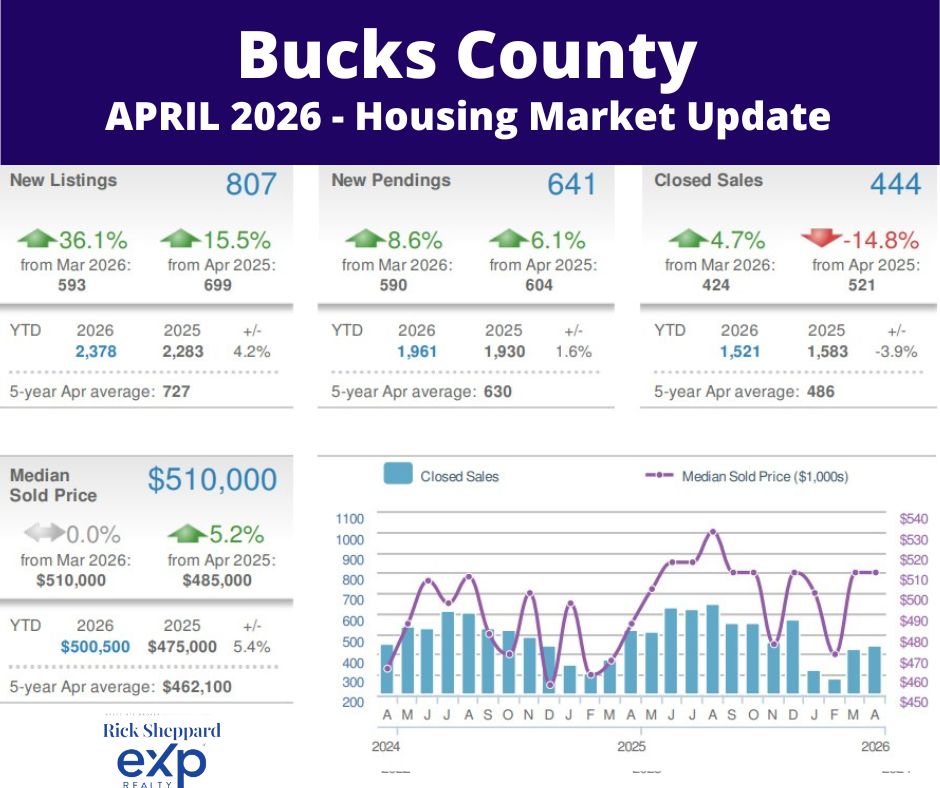
The Big Picture: April 2026 By the Numbers
April delivered a wave of fresh inventory, strong pending activity, and a median sold price that's holding firm at half a million dollars. Here's a snapshot of how the month stacked up:
|
Metric |
April 2026 |
Change from March 2026 |
Change from April 2025 |
|
New Listings |
807 |
+36.1% |
+15.5% |
|
New Pendings |
641 |
+8.6% |
+6.1% |
|
Closed Sales |
444 |
+4.7% |
-14.8% |
|
Median Sold Price |
$510,000 |
0.0% |
+5.2% |
|
Active Listings |
842 |
+32.6% |
+19.4% |
|
Avg. Days on Market |
22 |
-43.6% |
-4.3% |
The Nitty Gritty: What Does It All Mean?
Listings & Sales: A Spring Surge Worth Talking About
The headline number this month is impossible to ignore: new listings jumped 36.1% from March to 807 homes — a 15.5% increase over April 2025 and well above the five-year April average of 727. That's a meaningful influx of fresh inventory hitting the market right as buyer energy peaks. New pendings climbed 8.6% month-over-month to 641, signaling that buyers are absolutely showing up to compete. Closed sales came in at 444, up 4.7% from March, though still 14.8% below April 2025 — a reflection of the tighter inventory conditions that defined last year's spring market. Year-to-date, 1,521 homes have closed, tracking 3.9% behind last year's pace, but the pipeline is filling fast.
Prices: Half a Million and Holding Strong
The median sold price in Bucks County landed at exactly $510,000 in April — flat from March but a solid 5.2% above April 2025's $485,000. The YTD median of $500,500 is running 5.4% ahead of last year's $475,000 pace, confirming that appreciation is real and consistent. The five-year April average of $462,100 puts today's prices in sharp relief: Bucks County homeowners have seen meaningful equity growth over the past half-decade. The average sold-to-original-list-price ratio came in at 100.5%, meaning homes are still selling at or above asking price — a clear signal that sellers retain the upper hand in well-priced listings.
Inventory & Time on Market: Fast Moves in a Growing Pool
Active listings reached 842 at the end of April — up sharply from 635 in March and 19.4% above the 705 active listings recorded in April 2025. While inventory is growing, it's important to keep perspective: 842 is still at the high end of the five-year April range (495–842), meaning the market is not yet flooded. Homes that are priced right are moving quickly — the average days on market dropped to just 22 days, down from 39 in March and essentially flat versus April 2025's 23 days. A 22-day average DOM in a market with 842 active listings tells you buyers are engaged and decisive. This is still very much a seller-friendly environment, even as conditions gradually shift toward more balance.
Mortgage Rate Roundup
As we release this report on May 14, 2026, mortgage rates remain elevated but have shown some signs of stabilization. The average 30-year fixed-rate mortgage is currently at 6.46% [1]. For buyers, that translates to higher monthly payments than the historic lows of a few years ago — but with Bucks County's strong appreciation trend, waiting on the sidelines has a real cost too. Buyers who can qualify today are locking in equity gains that continue to outpace inflation.
The Bottom Line: Sellers Lead, But Buyers Have Options
April 2026 confirms that Bucks County's spring market is alive and well. Sellers benefit from a 5.2% year-over-year price gain, homes selling at 100.5% of list price, and an average of just 22 days on market. Buyers, meanwhile, are seeing the most inventory available in years — 842 active listings gives shoppers more choices than they've had in recent springs. The market isn't tipping dramatically in either direction, but well-priced, well-presented homes are still commanding top dollar. If you're thinking about selling, this spring window is as strong as it gets. If you're buying, the growing inventory means you may finally have a bit more room to breathe.
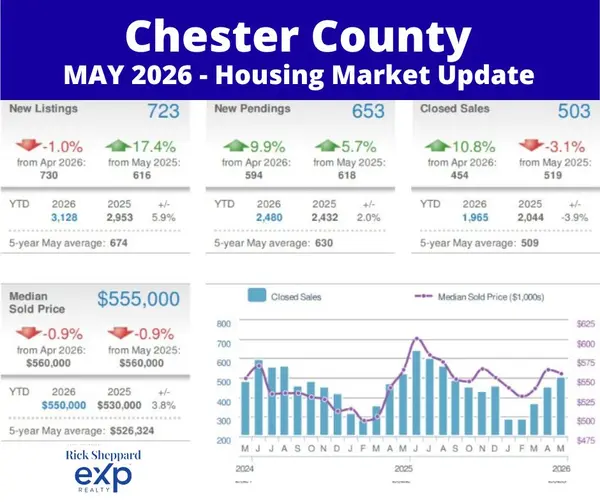
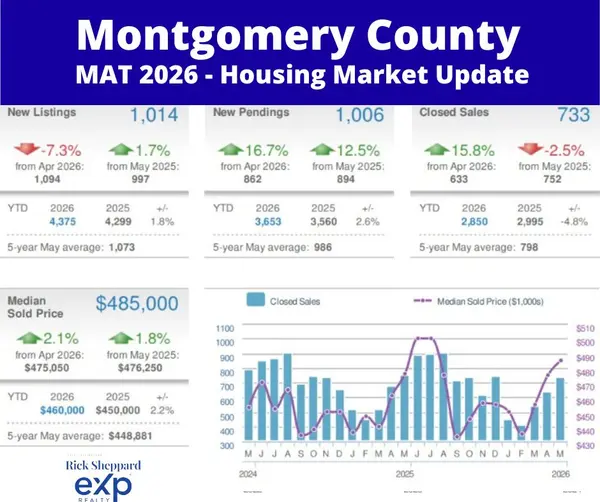
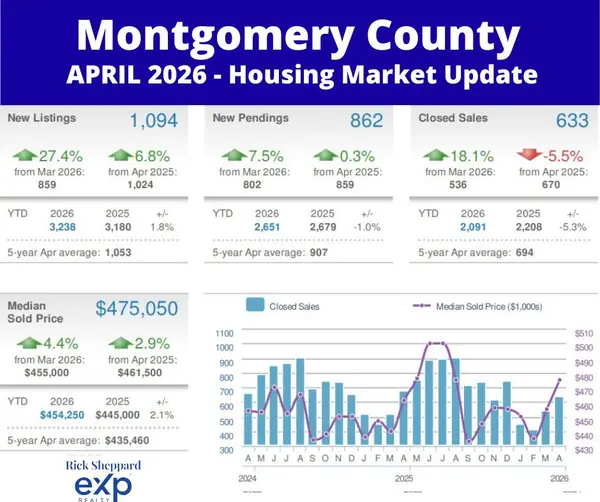
See how this compares to other local markets! Read our Montgomery County Market Report and Chester County Market Report for a full regional picture.
See what homes are really selling for in your neighborhood. Get your custom market analysis here – complete with hyperlocal pricing trends, inventory levels, and comparable sales data that matter most to your home buying or selling decision.
Categories
Recent Posts