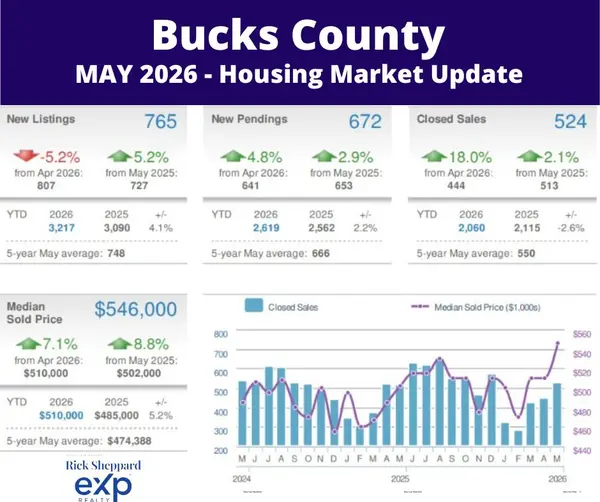
Bucks County Housing Market: Ending 2025 with a Bang!
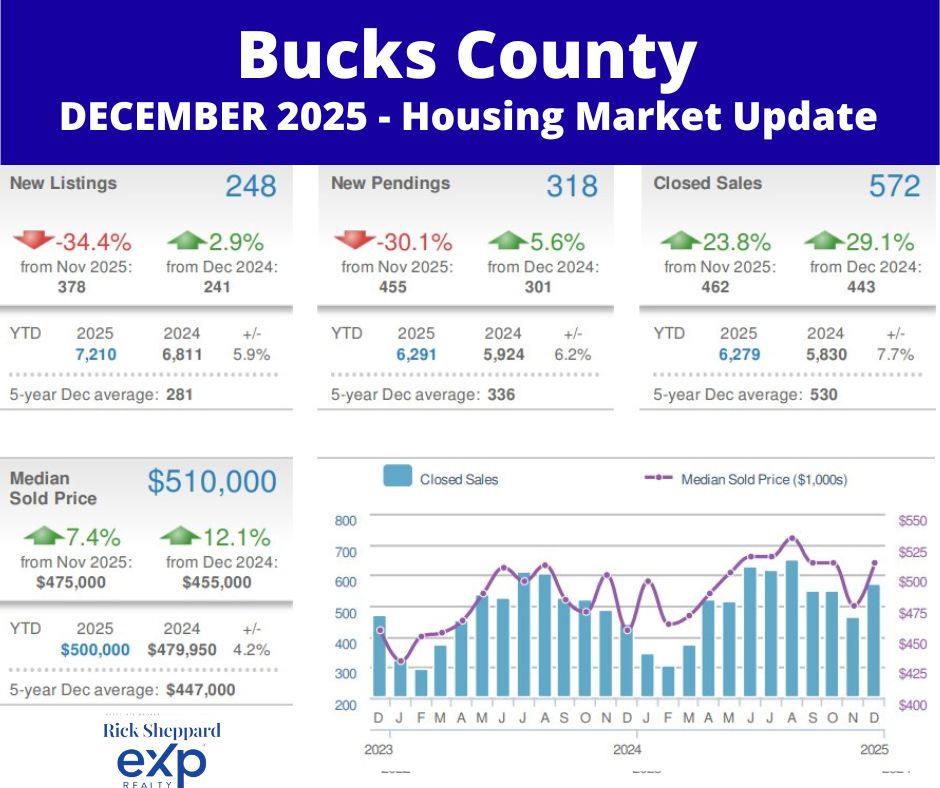
Well, folks, hold onto your hats! The final 2025 numbers are in, and the Bucks County housing market didn’t just end the year with a twist—it ended with a fireworks show. While other markets are settling down, Bucks County decided to accelerate right through the finish line. Now that we have the complete data, let’s break down the explosive finish to 2025.
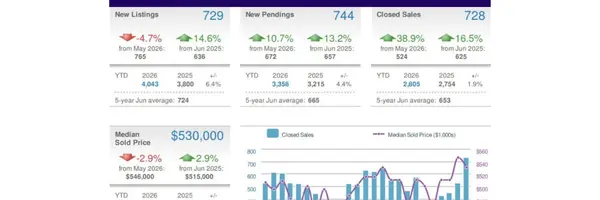
The Big Picture: December By the Numbers
|
Metric
|
December 2025
|
Change from Nov 2025
|
Change from Dec 2024
|
|
New Listings
|
248
|
-34.4%
|
+2.9%
|
|
Closed Sales
|
572
|
+23.8%
|
+29.1%
|
|
Median Sold Price
|
$510,000
|
+7.4%
|
+12.1%
|
|
Active Listings
|
593
|
-16.6%
|
+10.2%
|
|
Avg. Days on Market
|
32
|
+23.1%
|
+18.5%
|
The Nitty Gritty: What Does It All Mean?
Listings & Sales: A Surge of Serious Buyers
Prices: An Astonishing Leap
Inventory & Time on Market: Still a Seller’s Game
Mortgage Rate Roundup
2025 Year in Review: A Story of Consistent Strength
The Bottom Line: Full Steam Ahead into 2026
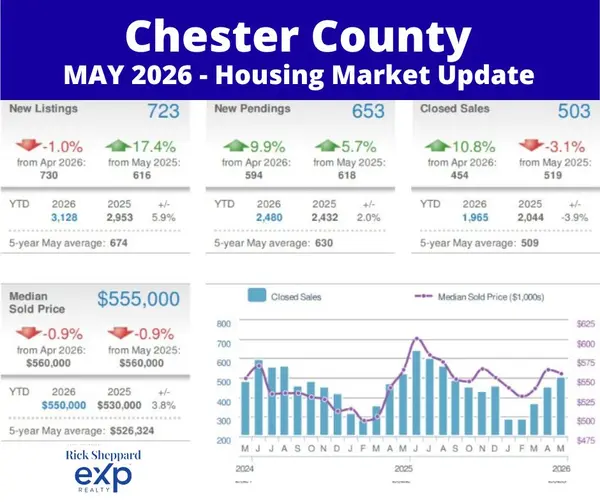
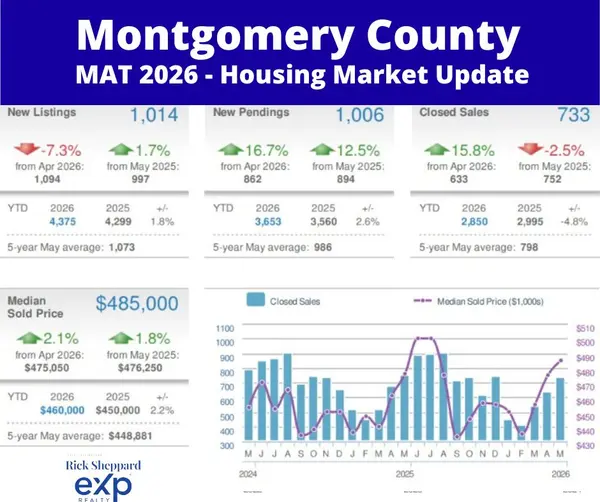
See how this compares to other local markets! Read our Chester County Market Report and Montgomery County Market Report for a full regional picture.
See what homes are really selling for in your neighborhood. Get your custom market analysis here. – complete with hyperlocal pricing trends, inventory levels, and comparable sales data that matter most to your home buying or selling decision.
Categories
Recent Posts