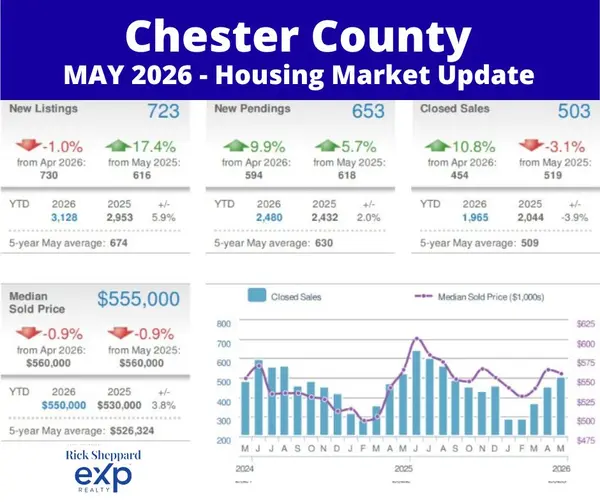
Chester County Housing Market: Ending 2025 on a High Note!
Well, folks, the final numbers for 2025 are in, and it’s clear the Chester County housing market didn’t just coast to the finish line—it sprinted. While other regions are talking about normalization, Chester County’s market seems to be playing by its own set of rules. Now that we have the complete data, let's dive in and see what made 2025 such a remarkable year.
The Big Picture: December By the Numbers
Let’s get straight to the vital signs for December 2025. The month wrapped up with a show of strength, particularly in home values.
|
Metric |
December 2025 |
Change from Nov 2025 |
Change from Dec 2024 |
|
New Listings |
206 |
-35.8% |
-12.7% |
|
Closed Sales |
455 |
+6.3% |
+9.6% |
|
Median Sold Price |
$550,000 |
-2.0% |
+8.4% |
|
Active Listings |
587 |
-20.6% |
+8.7% |
|
Avg. Days on Market |
28 |
+12.0% |
+16.7% |
The Nitty Gritty: What Does It All Mean?
Listings & Sales: Low Supply, High Demand
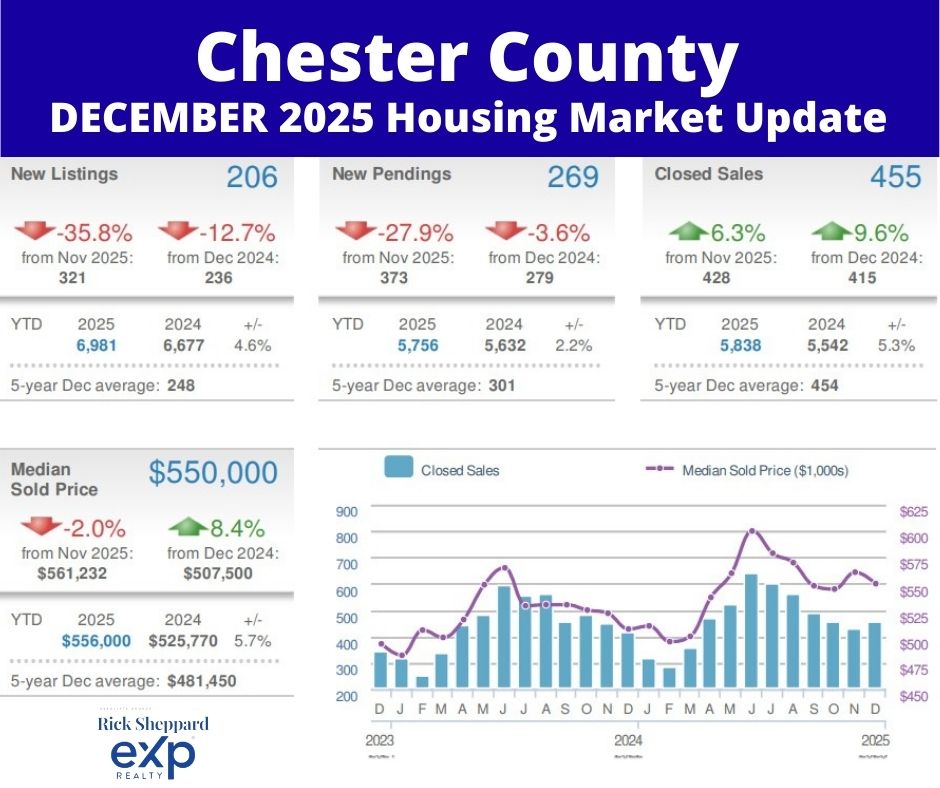
December saw a predictable drop in new listings, down 35.8% from November, as sellers held off during the winter. However, buyer demand remained unwavering. Closed sales climbed 6.3% from the previous month and a notable 9.6% from December 2024. This dynamic—fewer homes for sale but more homes being sold—points to a competitive market where determined buyers are acting fast.
Prices: The Star of the Show
Here’s where Chester County truly shines. The median sold price in December hit a stunning $550,000, a massive 8.4% increase from the same time last year. While many markets are seeing prices level off, Chester County continues to demonstrate powerful value growth. This tells us that buyers are willing to pay a premium for the quality of life and homes our county offers.
Inventory & Time on Market: A Seller’s Playground
While active listings were up slightly from last year (+8.7%), the sharp drop from November combined with strong sales kept inventory tight. Homes took an average of 28 days to sell, a bit longer than last year but still a swift pace. In this environment, sellers who price their homes correctly are still in a commanding position.
Mortgage Rate Roundup
Some great news for buyers heading into the new year! As of mid-January 2026, the average 30-year fixed-rate mortgage has dipped to 5.8% APR [1]. This is the lowest rate we’ve seen in over a year, which could provide a significant boost to affordability and bring even more buyers into the spring market.
2025 Year in Review: A Year of Impressive Growth
Looking back at 2025, Chester County’s housing market wasn’t just stable—it was thriving. It stands out as one of the strongest markets in the region.
- Powerful Price Gains: The median sold price for the entire year was $556,000, a robust 75% increase over 2024.
- More Homes Sold: The number of units sold climbed to 5,838, a healthy 34% increase from the previous year.
- Sellers Had the Edge: For the year, the average sold-to-list price ratio was 5%, meaning the average home sold for above its asking price. That’s a testament to the market’s strength.
These numbers paint a picture of a market defined by high demand and strong, sustained value. While the national trend was one of “normalization” [2], Chester County’s story was one of resilience and growth.
The Bottom Line: Momentum Heading into 2026
Chester County’s housing market ended 2025 with significant momentum. Strong buyer demand, impressive price appreciation, and a slight easing of mortgage rates create a very interesting setup for the spring market. This is not a market that’s cooling off; it’s a market that continues to prove its desirability.
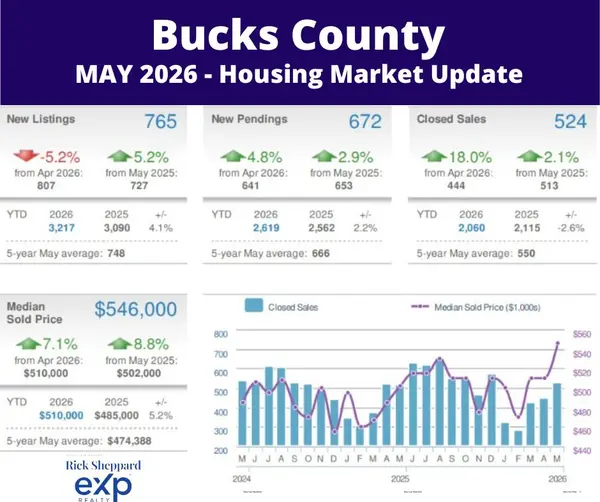
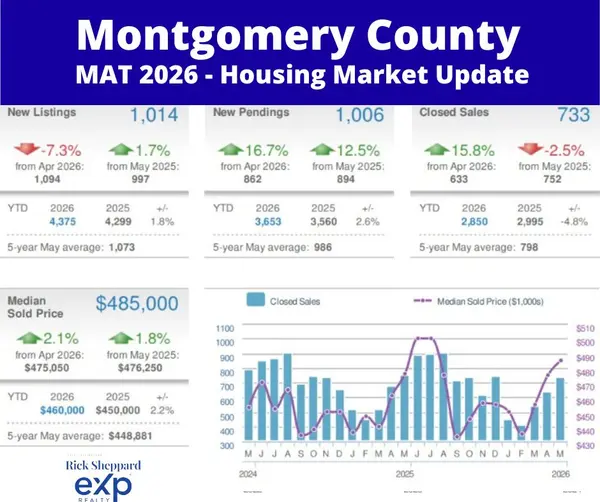
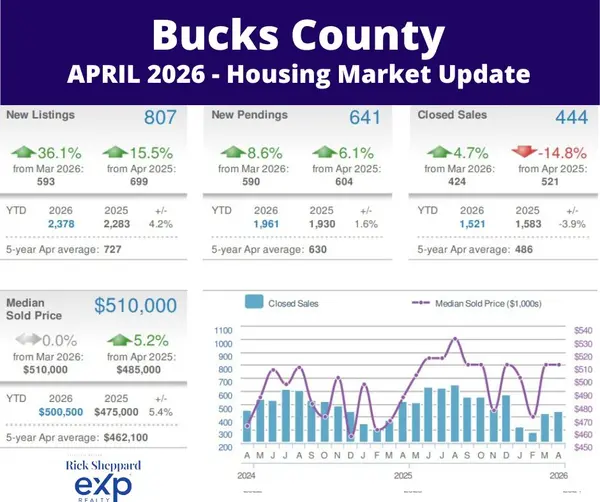
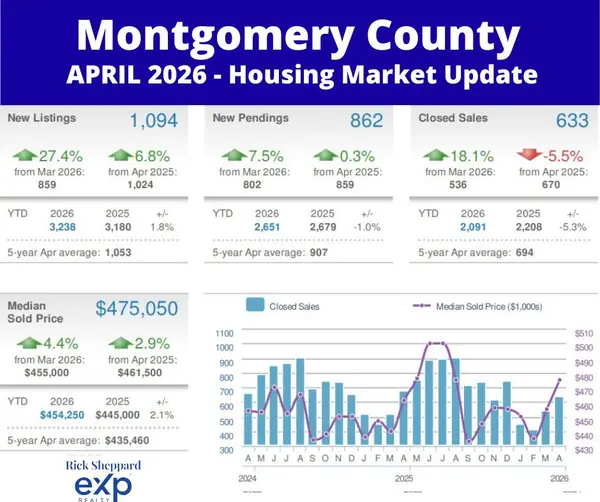
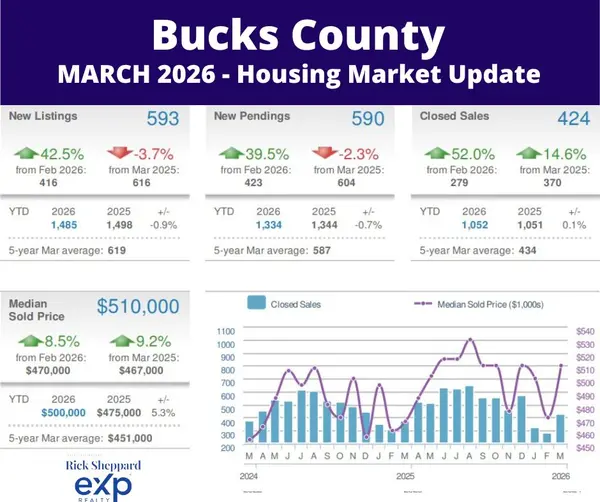
See how this compares to other local markets! Read our Montgomery County Market Report and Bucks County Market Report for a full regional picture.
See what homes are really selling for in your neighborhood. Get your custom market analysis here – complete with hyperlocal pricing trends, inventory levels, and comparable sales data that matter most to your home buying or selling decision.
Categories
Recent Posts